
Why Splits Matter in Nostalgia Sim Baseball
This article is not intended as a comprehensive explanation of splits. We assume basic knowledge of splits and how they function in the game of baseball. This article deals with the more problematic aspects of approaching split stats when data is missing. Nevertheless, some knowledge of why splits matter in the sim is integral to gaining that often-elusive "managerial edge."
The Elusive "Managerial Edge"
Whether a player's performance in Left/Right situations is truly linked to the skill set of the batter and pitcher is unclear when the sample size is small. And splits may reverse trend from season to season. It's common to see a batter do better against lefties one season and a reversal in the following season. Yet, over the course of a career what looks like haphazard flip-flopping settles into a longitudinal trend. We can expect lefty-lefty and righty-righty matchups to be tougher on batters because those trends endure through time. Because our sim makes split stats an integral part of sim, managers can utilize these trends to their advantage. Some things to consider:
- The more extreme a player's variation in Home/Road or Left/Right situations, the more he can be utilized to your advantage. A pitcher that is much better at home than on the road, can be given a disproportional number of starts at home to provide an advantage.
- Lineups can be created according to Rome/Road and Left/Right splits to maximize these advantages on a regular basis.
- A left-handed batter who hits well against lefties or a right-handed pitcher who does better against left-handed batters (i.e., breaks the mold) is likely more valuable than their raw monetary value shows.
Our sim keeps a cumulative record of a players situational performances in the so-called sim database. That data can be researched and studied prior to drafts, trades, and waiver acquisitions, to maximize the effectiveness of your team in your ballpark.
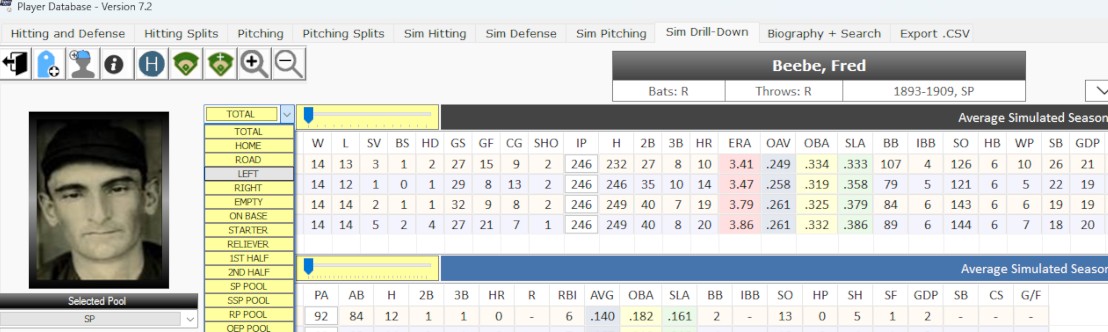
By using the dropdown controls in the Sim Drilldown Tab of the Database, one can research long-term trends on player stats. Seasonal historical splits can be viewed on the Hitting Splits and Pitching Splits tabs (same window).
Splits in Negro League Player Records
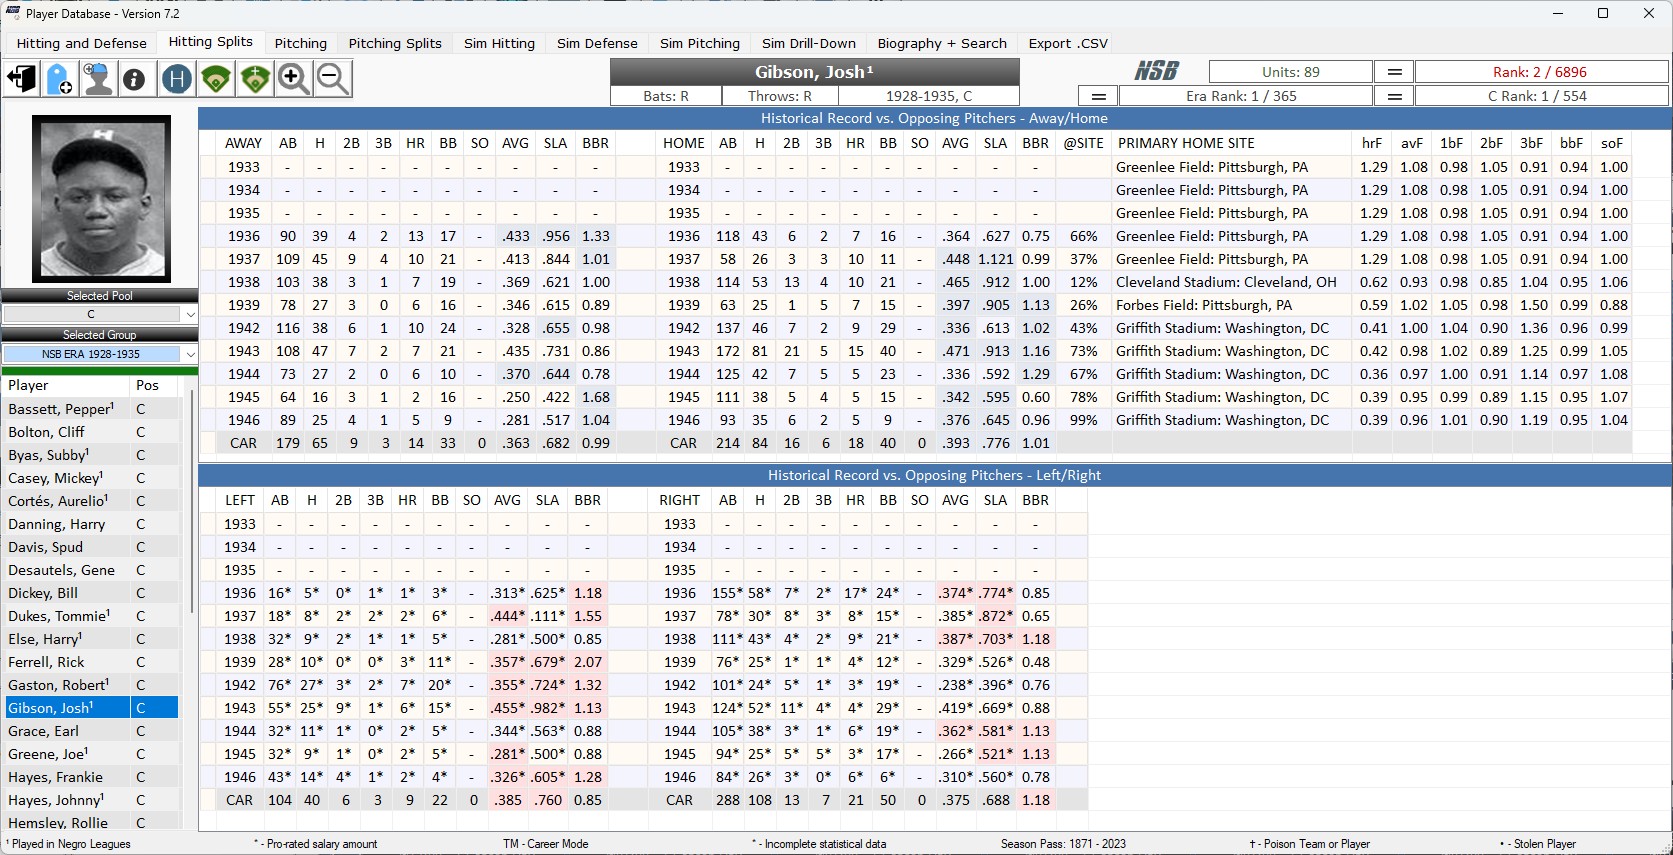
Stat splits are available for Negro League Players from 1936-1948. Home/Road stats are complete. Left/Right stats are partial, but we use previously-developed NSB algorithms to model/project these partials to realistic full-season scenarios. Home/road stats for the Negro Leagues introduce a new challenge to our game because so many games were of the "barnstorming" type, i.e., games played at parks across the country where one side would be arbitrarily selected as the "home" team. For this reason, we have researched the primary site for a player's "home" games and the percentage of play at that venue. This allows us to make realistic park adjustments to player stats. This data is shown on the splits tabs in the database. Behind this seemingly small enhancement lies an ambitious set of coding initiatives to determine ball park factors for the many, many parks where Negro League games were played. These factors are shown on the home split side of the database displays (see image below). As research unfolds, we will be able to further refine park factors and player stats for the years 1920 - 1935. The work is ongoing.
Thanks to the work of Retrosheet, we are able to add exhibition games, all-star games, and playoff games to the regular season games to produce a more rounded picture of performances. This now means that, unlike all other leagues, Negro League Players are not in “sealed” league universes. While this presents simulation challenges, we have decided that more data is better data for Negro League players since the data is sparse to begin with.
In the screen sample below, Josh Gibson's Home record shows his primary home site. Since many games were barnstormed or played in neutral parks where one team was arbitrarily selected as the "home" team, to get an accurate home park effect we must consider the primary site, the percentage of home plate appearances that took place place there, and work that into the overall probability structure. This differs from how we treat most other players, who almost always played the vast majority of their home games in the same park.
Handling Split Data when it's Incomplete
This section was written in response to a policy change of August 2016. Though useful information about all stat splits can be found here, it focuses on the way the sim handles left/right matchups when only partial split data is available.
Probabilities for batter-pitcher matchups are exceedingly complex. To get the best set of probabilities it is important for a sim to create a baseline series of probabilities taking into consideration players’ relative strength compared to the leagues and seasons they actually played in, the ballpark in which the game is taking place, play-fatigue, and a few other game-time conditions (e.g., whether the infield in in or deep, whether lines are being guarded, etc.)
On top of this baseline another complex set of formulas is used to asses the situational context (i.e., batting and pitching splits) in which batter-pitcher matchups take place. There are four main situational contexts used by Nostalgia Sim Baseball:
- The handedness of the batter and the pitcher (LHB v LHP, LHB v RHP, RHB v LHP, RHB v RHP)
- The location of the matchup (HOME v ROAD)
- The state of baserunners (BASES EMPTY v ON BASE)
- Whether the batter is pinch hitting
However, these sets of conditions are not weighted equally. #1 is weighted more heavily than #2, and #2 is weighted more heavily than #3. In fact, #3 is called upon only to determine the chance of a batter getting a walk. #4 is weighted as heavily as #1, although if a pinch hitter exceeds his actual pinch plate appearances then probabilities regress to his performance mean.
Before August 2016, the sim would only use split data from seasons where all split data was complete. From 1973 on, all split data is complete. Before 1973 there are increasing numbers of games missing from the data record, making it less reliable, although there are complete data sets before 1973 in a number or cases, and the research work continues over at Retrosheet. It’s much easier to get complete data for home/road splits than for left/right splits, because the former can be garnered from box score analysis.
Effective August 2016, however, a major initiative was completed to make our sim conducive to using whatever partial left/right split data we have. To do this well required lots of retrofitting, but we are pleased with the results. And we want to share with you how we did it so that there are no mysteries in your players’ performances.
Before going any further, two things:
-
Partial Left/Right Stats are published in the owner software package in the database window on the split tabs. Whenever a partial stat is in use, it is followed by an asterisk. You will also note two columns at the right headed “RPL” and “PERF”. These indicate the percentage of real play (RPL) represented in the split–the higher the percentage the more accurate the data–and the performance level (PERF) as a factor (.98 or 1.03 etc.) of the player’s total performance.
-
Remember that the nature of probabilities is often different than we suppose. To see the real effects of splits work themselves out, many thousands of plate appearances may be required. In any given simulated season, performance can vary quite wildly. So, just because Ken Caminiti his .230 against lefties and .265 against righties in 1998, it does not guarantee that he will hit better against righties if he plays on your team. If he plays for you, he will be facing different pitchers in different parks under the direction of different managers. But let’s say that over a period of 12 months Caminiti’s 1998 season was played 10-15 times across the NSB system. With that sample size we would begin to see the larger probabilities play themselves out. Probabilities are always potential outcomes, not certain outcomes.
Now, the big problem we faced in introducing partial splits was how to keep from unfairly prejudicing performance (positive or negative). For example, look at the following stats for Fred Schulte in the 1929 season.
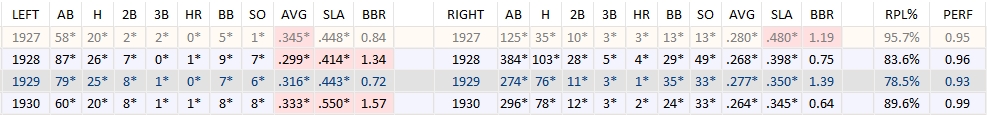
In 1929 we have managed to get 78.5% of Schulte’s left/right plate appearances. In those appearances, he performed worse than he did overall for 1929. If we allow Schulte’s left/right probabilities to be determined by this data, truthful though it is, we would be using left/right data to his disadvantage.
So, to correct this, we must create a profile of the remaining 21.5% of his left/right appearances using what we know about the broader tendencies of matchups. When we do this, we get the following adjustments to the left and right sides:
![]()
These adjusted numbers match up exactly to Schulte’s total AB,H,BB,2B,3B,and HRs for the 1929 season. We can’t be certain this is the actual 1929 result, but we have created a model profile with a PERF factor now at 1.00. Schulte will now not be penalized for using his left-right splits. We do the same, naturally, for pitchers.